


Market mapping is a visual technique frequently used by businesses that aid in comprehending market dynamics and competitive landscapes. Looking into the concept of market mapping can provide insights into its potential advantages for your team. This article delves into the essence of market mapping, elucidates its benefits for businesses, and outlines diverse methodologies for mapping a market.
What Is It Market Mapping
The mapping of your competitive landscape is called market mapping.
It’s the technique of charting specific rivals using a pair of criteria on a graph to see a particular competitive landscape.
Through the visual representation of the market provided by this mapping process, businesses may identify gaps and opportunities resulting from unmet customer wants.
The audience may be able to identify an unexplored potential or a gap in the market by using the appropriate set of criteria while creating the map.
Stated differently, a well-utilized market map may serve as an invaluable instrument for positioning.
What Makes Market Mapping Vital?
The term “market” may conjure images of classic market booths manned by sellers offering fresh goods like cheese, cured meats, and vegetables.
However, the majority of markets are virtual spaces, and it is difficult to view or visualize the competitive landscape in a form that is useful for study or comparison.
Business executives may find it simple to assume the worst about their competitors and think they know everything about their advantages and disadvantages, but this may lead to expensive lost opportunities.
Pros and Cons of Market Mapping
Regarding brand positioning, there isn’t a secret code or panacea.
The positioning map, like other industrial tools, has various benefits and drawbacks. Let’s examine them in more detail.
Benefits Of A Market Map
Business executives and marketers have been using market mapping for decades.
Despite not being state-of-the-art in terms of science, this technology can nonetheless be quite effective.
These are a few of the benefits:
Generates a picture
Shows the whole market
Simple to comprehend
Direct contrast with rivals
A limitless array of possible combinations
Rapid market research
The Drawbacks Of A Market Chart
Although utilizing a market map has numerous benefits, it’s not a perfect science, and there are certain drawbacks that need to be taken into account. These drawbacks include:
Not precise enough in terms of science
Subjectiveness is possible
Possibly prejudiced
Absence of data or statistics
Only using two factors
Market Mapping Variable Examples
The positioning map, also known as the perceptual map, that is used in market mapping is really quite basic.
However, there is strength in that simplicity, and the significance and originality of the factors used have a significant impact on the map’s worth and the outcomes it generates.
Almost any variable may be plotted, but the more closely you align with the critical elements influencing purchasing decisions, the more significant and valuable the gaps and opportunities you uncover will be.
These are some examples of market mapping dimensions or variables.
Expensive vs. Cheap
Low vs High Quality
High Tech vs. Low Tech
Simple vs Complex
Small vs. Long Turnaround
Low vs High Capability
Luxury vs. Need
Good vs. Unhealthy
Disconvenient vs Easy
The Greatest Market Mapping Method & Template
The key to getting the greatest outcomes in branding, like with anything else, is to have reliable procedures that you can employ again.
Therefore, you may use this step-by-step template to position your brands or the brands of your clients in their competitive environment.
1. Divide up your market.
You should be very clear about the market segment you’re targeting before you start identifying factors and mapping out your competition.
Every market has a variety of sectors that vary from one another in terms of their goals, anxieties, difficulties, drives, and, of course, their purchasing habits.
One market group may place a high value on a factor while making a purchase, whereas another may not rank it among the top ten reasons.
Thus, when you have defined your market, identify the categories that you want to target.
2. Identify Your Variables
The elements that influence purchasing decisions vary from market to market and from market segment to market, as I just discussed in step one.
The more familiar you are with the market group you want to target, the more precise you can be in determining the elements that influence their decision-making.
These variables are the most effective ones for market mapping.
You have the components of a potent positioning strategy if you can identify a gap in the market based on two crucial decision-making elements.
Recall that your chances of discovering a special opportunity increase with the number of variables and combinations of factors you map your market with.
3. Evaluate Your Competators
To begin with, you need some plot points to deal with before you can design any market maps.
Putting the necessary data into a spreadsheet is the easiest method to go about this.
List all of your rivals in the market in the first column. The factors you’ve discovered should then appear in each subsequent column.
There will be highs and lows for any variable you use. For instance, if you were to plot the price variable, you would have both a low and a high price.
You wish to designate a number out of 10 for every variable. An extreme high point should be worth ten points, while an extreme low point should be worth one.
4. Draw Out the Layout of Your Market
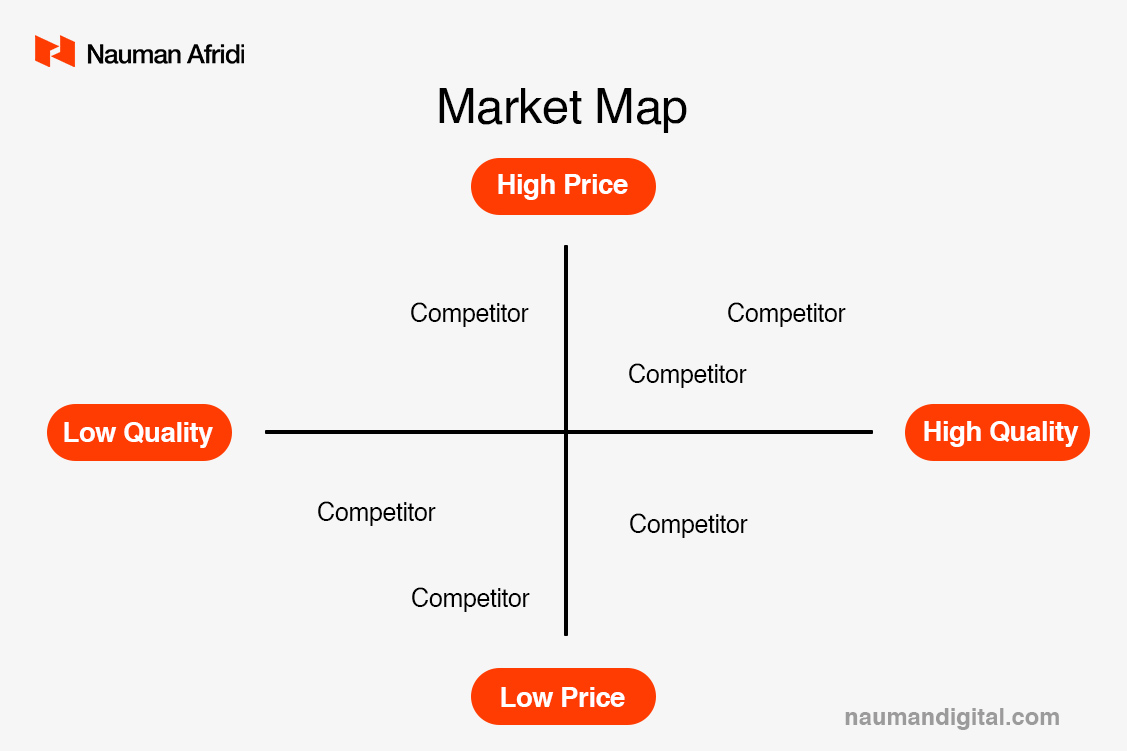
Once you have the scores for each competitor’s variables, switch up the combinations on different maps.
For instance, you may utilize the y- and x-axes for “price” and “quality,” respectively, provided you’ve determined that these are significant factors.
Naturally, you’ll need more maps for the more variables you utilize since there will be more combinations.
Plotting the brands of your rivals over each map is the next step after creating your maps with your variable combinations.
This may take some time if you’ve found a lengthy number of variables, but as long as your variables are factors that influence purchasing decisions, the work invested will be worthwhile.
5. Find Opportunities & Gaps
Upon creating a number of maps according to your set of factors, you will probably be able to observe your market graphically for the first time.
Your competitors may be equally distributed on certain maps, while they may be crammed together on one side or in one quadrant on others, depending on the combination of factors you employed.
Blue Ocean Strategy is a book written by Renee Mauborgne and W. Chan Kim.
The concept behind the name is that blue waters stand for opportunity, whereas red oceans are full of sharks, representing your rivals.
The blue ocean and the gaps and possibilities that come with market mapping are represented by the vacant space on your maps, while the crowded parts are the red ocean.
Final Thoughts
Every brand starts with a plan, and every brand strategy starts with a distinctive stance.
It serves as the focal point of the brand, around which all other elements are developed and shown.
One of the hardest parts of branding is coming up with a distinctive stance, therefore you need to have as many useful tools as you can discover.
It is not cutting edge, it is not rocket science, and it is not infallible.
However, you may strike gold in the rare opportunity you’re looking for if you spend the time your rivals don’t map your terrain efficiently.
![How to Create a Brand Strategy [Comprehensive Guide]](https://naumandigital.com/wp-content/uploads/2023/10/brand-strategy-1-600x400.jpeg)

![Premium Pricing Strategy [Pros, Cons & Top Examples]](https://naumandigital.com/wp-content/uploads/2023/10/WhatsApp-Image-2023-10-24-at-1.46.51-PM-600x400.jpeg)
![What is Brand Portfolio? [Strategies, Models and Examples]](https://naumandigital.com/wp-content/uploads/2023/10/fedex-brand-architecture-600x400.jpg)